Fluorescence
Molecules absorbing the energy of electromagnetic radiation (i.e., photons) will be elevated to a higher energy level, or excited state. These excited molecules will return to the ground state and some molecules emit radiation on their return to the ground state. This phenomenon is known as fluorescence and fluorescent molecules are known as fluorochromes.
Fluorochromes have distinct absorption spectra as well as emission spectra. The wavelengths of the emitted radiation are longer than the absorbed wavelengths (i.e., lower energy).
Fluorescence is widely used in the biological research. In particular, many molecules absorb in the ultraviolet range (UV) and emit radiation in the visible range. These fluorochromes can be used as sensitive probes to investigate biological phenomenon and are utilized in many different applications (Box).
Enzyme Assays And Fluorometers
Enzyme substrates are available in which either the product or the substrate is fluorescent. As in the case of spectrophotometry, this provides a convenient method to either follow the appearance of product or the disappearance of the substrate. In general fluorescent substrates provide greater sensitivity than conventional spectrophotometric assays. The amount of fluorescence is measured using a fluorometer. The fluorometer is similar to a spectrophotometer, except that the photomultiplier tube to detect the emitted light is located at a right angle from the path of the excitation light (Figure). The sample is exposed to UV light of the desired wavelength and emitted light of the appropriate wavelength range is detected by a photomultiplier tube. The intensity of the emitted light is quantified and usually expressed as relative fluorescence units.
Fluorescence Microscopy
Since many fluorescent molecules emit light in the visible range it is possible to view fluorescence in conjunction with microscopy. An UV light source is used to illuminate the sample through the objective lens using a beam-splitting mirror. The fluorescence emitted from the sample (epifluorescence) passes through this same mirror, but the UV light does not. Filters before the beam splitting mirror will control the excitation wavelength and filters before the eyepiece (or camera) will control the wavelength of the emitted light.
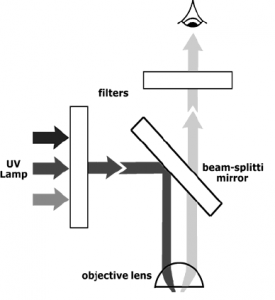
Fluorescent probes can be used to identify individual cells or subcellular components (Box). The location of fluorochromes associated with cells will appear as light objects against a dark background. Immunofluorescence (discussed in greater detail in immunoassays) uses antibodies with a conjugated fluorescent molecule (eg., fluorescein or rhodamine) to determine the location of a protein within a cell. Numerous fluorescent dyes which bind to specific subcellular components are also available. For example, acridine orange fluoresces when it binds to either RNA and DNA. Acridine orange bound to RNA fluoresces a yellow to green color and acridine orange bound to DNA fluoresces orange to red.
Other fluorescent probes which bind to specific subcellular compartments are also available. In addition, there are many fluorescent probes available that are sensitive to pH, divalent cations such as Ca2+, and membrane potentials. Such probes permit physiological measurements in individual living cells. Dual-labeling experiments in which fluorochromes with different emission spectra are co-incubated with the sample can also be carried out. The different fluorochromes will appear as different colors due to the differences in their emission spectra. If the emission spectra are far enough apart then it is possible to use filters so that the two fluorochromes are examined separately. Dual-labeling experiments are especially useful for determining whether two proteins (or other substances) are localized to the same subcellular compartment.
Confocal scanning laser microscopy (CSLM). The confocal microscope increases the resolution, as compared to conventional fluorescent microscopy, by minimizing the light from out of focus planes. In CSLM the illuminating light, a laser, is focused onto the specimen by the objective lens. Light reflected back from the illuminated area is collected by the objective and directed through a pinhole placed in front of the detector. This diameter of the pinhole can be controlled and determines the thickness of the focal plane. This confocal pinhole rejects light that did not originate from the focal plane. A thinner optical plane (i.e., smaller pin hole diameter) provides a higher degree of resolution since interference from other planes is minimized.
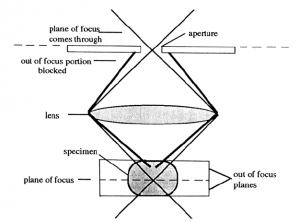
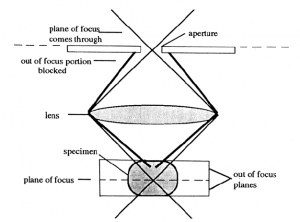
The image is produced by scanning the optical field pixel by pixel (x, y dimensions) with the laser and collecting the fluorescence intensity with a photomultiplier tube. A computer generates the image from this fluorescence data. In the case of dual- or multiple fluorchromes the data on the different wavelengths is collected separately and assigned different colors. Images of the separate fluorochromes or a merge image can then be displayed or exported into a file.
It is also possible to section a specimen into several optical planes by moving the stage vertically (z-dimension). This requires a computer-controlled motor to precisely move the stage according to the specified distances. The process of making these ‘optical sections’ involves setting the focal plane at the bottom of the specimen, recording the image in digital form, and moving the stage up a prescribed distance. Another digital picture is taken and the process is repeat throughout the thickness of the specimen resulting in images of consecutive focal planes separated by a specific interval. These digitized images are stored and can be viewed in sequence. In addition, three-dimensional images can be reconstructed from the optical sections through the use of computers.
Flow Cytometry
Fluorescent microscopy provides qualitative information about individual cells. However, obtaining quantitative data is difficult and labor intensive. Fluorometry provides quantitative data, but represents the average of the population being analyzed. In other words, fluorometry does not reveal information about heterogeneity within that population. Flow cytometry can provide quantitative information on individual cells.
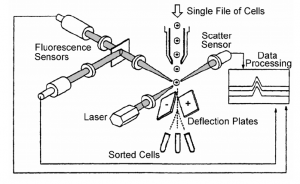
The principal of flow cytometry is to pass cells (or particles), in single file through a laser beam and analyze the interaction of the laser with individual cells (Figure). For example, the scatter (i.e., direction change) of the laser provides information about the size and shape of the cell. In addition, cells can be labeled with fluorochromes which are excited by the laser. The amount of fluorescence associated with the cells provide quantitative data on specific target molecules or their subcellular constituents.
Flow cytometry can quantify virtually any cell-associated factor or organelle for which there is a fluorescent probe (or natural fluorescence). For example, the amount of DNA per cell can be measured and provide information about the proportions of cells in various phases of the cell cycle. Through the use of multiple detectors and lasers it is also possible to analyze two or more fluorochromes with different emission spectra simultaneously. The data for the various cellular parameters being measured are accumulated for each cell and sub-populations can be identified and characterized. For example, the data can be plotted as dots defined by the fluorescence values of the two fluorochromes (Figure). The number of cells with particular characteristics are tabulated and their distributions in the cell population determined.
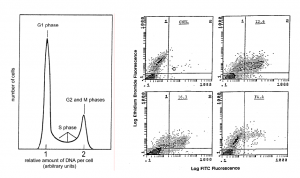
In addition, many flow cytometers are equipped with a cell sorter, or a fluorescence activated cell sorter (FACS). Cell sorting is accomplished by passing the cells between a charged plate and applying a pulse of current to cause the cell to change directions. In this way cells with particular characteristics (i.e., predetermined levels of fluorescence, scatter, etc.) can be separated from a mixture of cells. The separated cells can then be subjected to other analyses.