1. Introduction to Bacterial Growth
Bacterial growth represents one of the most fundamental processes in microbiology, with profound implications for fields ranging from medicine to biotechnology. Unlike multicellular organisms that grow through an increase in cell size, bacterial growth primarily refers to an increase in population size through cell division. This process, known as binary fission, involves a single bacterial cell doubling its cellular contents and dividing into two identical daughter cells.
The bacterial growth curve serves as a graphical representation of bacterial population dynamics over time when grown in a closed culture system. This mathematical and biological model has become a cornerstone concept in understanding bacterial behavior, developing antimicrobial strategies, optimizing industrial fermentation, and predicting the shelf life of food products.
The study of bacterial growth curves began in the early 20th century with pioneering work by microbiologists like Jacques Monod, who developed mathematical models to describe the relationship between bacterial growth and substrate concentration. These early studies laid the foundation for our modern understanding of bacterial population dynamics and the distinct phases that characterize bacterial growth in laboratory settings.
2. Factors Affecting Bacterial Growth
Before examining the growth curve itself, it’s important to understand the various factors that influence bacterial growth rates and patterns:
- Nutritional Factors:
- Carbon sources provide energy and structural components
- Nitrogen sources supply materials for protein synthesis
- Trace elements serve as cofactors for essential enzymes
- Vitamins and growth factors fulfill specific metabolic requirements
- Physical Factors:
- Temperature: Each bacterial species has an optimal growth temperature range, with defined minimum, maximum, and optimal temperatures. Bacteria are classified as psychrophiles (cold-loving), mesophiles (moderate temperature), thermophiles (heat-loving), or hyperthermophiles (extreme heat) based on their temperature preferences.
- pH: Most bacteria grow optimally in a narrow pH range (6.5-7.5), though acidophiles and alkaliphiles thrive in acidic and alkaline environments, respectively.
- Osmotic Pressure: Cellular functions depend on appropriate internal osmotic conditions, with excessive salt concentrations causing plasmolysis (cell shrinkage) and hypotonic conditions leading to cell rupture.
- Redox Potential: The electron availability in the environment affects growth, with anaerobes requiring reduced conditions and aerobes needing oxidized environments.
- Biological Factors:
- Competition between different microbial species
- Presence of bacteriophages (viruses that infect bacteria)
- Quorum sensing (population density-dependent signaling)
- Production of inhibitory compounds by competing organisms
- Growth Medium Composition:
- Rich media (containing complex nutrients like peptones and yeast extract)
- Defined media (with precisely known chemical composition)
- Selective media (favoring certain bacterial types while inhibiting others)
- Differential media (allowing visual distinction between bacterial types)
- Culture Conditions:
- Batch culture (closed system with finite resources)
- Continuous culture (open system with continuous nutrient replenishment)
- Fed-batch culture (batch culture with periodic nutrient addition)
- Solid versus liquid culture environments
These factors not only determine whether bacteria will grow but also significantly influence the shape and duration of each phase in the bacterial growth curve.
3. The Four Classical Phases of Bacterial Growth
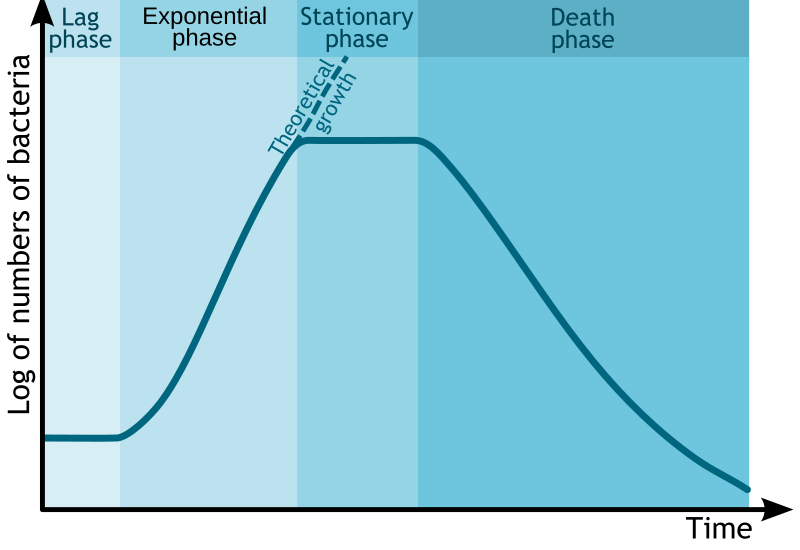
The bacterial growth curve in a batch culture system traditionally consists of four distinct phases, each reflecting different physiological states and growth patterns of the bacterial population:
- Lag Phase:
- Definition: The initial period after bacteria are introduced into fresh medium during which there is minimal or no population growth despite metabolic activity.
- Cellular Activities:
- Synthesis of enzymes, ribosomes, and other macromolecules
- Repair of cellular damage
- Adaptation to new environmental conditions
- Expression of genes necessary for utilizing available nutrients
- Duration Factors: The lag phase may last from a few minutes to several days depending on:
- Age and condition of the inoculum
- Size of the inoculum
- Difference between previous and new growth environments
- Time required for cell damage repair
- Metabolic State: Cells show high metabolic activity but no division, with significant RNA synthesis and protein production.
- Exponential (Log) Phase:
- Definition: The period of rapid, balanced growth where bacteria multiply at their maximum possible rate under the given conditions, following first-order kinetics.
- Mathematical Expression: The growth follows the equation N = N₀ × 2^n, where:
- N = final number of cells
- N₀ = initial number of cells
- n = number of generations
- Growth Rate: Characterized by constant doubling time (generation time) specific to each bacterial species and growth condition.
- Cellular State: Cells are typically uniform in size, shape, and metabolic activity, with all cellular components synthesized at constant relative rates.
- Vulnerability: Bacterial populations are most susceptible to antibiotics and other growth-inhibiting agents during this phase, especially those targeting cell wall synthesis or DNA replication.
- Stationary Phase:
- Definition: A period of equilibrium where the growth rate equals the death rate, resulting in a plateau in the population curve.
- Triggering Factors:
- Nutrient depletion (carbon, nitrogen, or essential micronutrients)
- Accumulation of metabolic waste products
- Oxygen limitation in aerobic cultures
- Unfavorable pH changes
- Space constraints in the culture environment
- Physiological Adaptations:
- Induction of stress response genes
- Formation of storage compounds like glycogen or polyhydroxybutyrate
- Development of general stress resistance
- Reduced ribosome synthesis
- Alternative metabolic pathways activation
- Cell Density: Typically reaches 10⁹-10¹⁰ cells/ml in rich media for many bacterial species.
- Death or Decline Phase:
- Definition: The period characterized by a net decrease in viable cell numbers due to environmental stresses exceeding cellular repair capabilities.
- Pattern: Often follows first-order kinetics (logarithmic death), but can show complex patterns depending on species and conditions.
- Cellular Processes:
- Ribosome degradation
- DNA fragmentation
- Membrane integrity loss
- Autolysis (self-digestion)
- Survival Mechanisms: Some bacteria enter viable but non-culturable (VBNC) states or form endospores to survive harsh conditions.
- Ecological Relevance: Microbial succession occurs as dying cells release nutrients that may support secondary growth of resistant subpopulations or different species.
4. Additional Growth Phases
Beyond the four classical phases, researchers have identified additional phases that provide a more nuanced understanding of bacterial growth dynamics:
- Lag 1 and Lag 2 Phases:
- Lag 1: Represents the “true lag” where cells adapt physiologically without any growth.
- Lag 2: Shows slight growth as cells begin to divide but not at maximum rate.
- Significance: This subdivision helps distinguish between adaptation time and early growth initiation.
- Accelerating Growth Phase:
- Occurs between lag and exponential phases
- Growth rate gradually increases as cellular machinery becomes fully operational
- Not always distinguishable in standard growth curves without high-resolution measurements
- Decelerating Growth Phase:
- Transition period between exponential and stationary phases
- Growth rate decreases progressively as resources become limited
- Often exhibits unbalanced growth with differential rates of macromolecular synthesis
- Prolonged Stationary Phase:
- Extended survival period lasting days to months
- Characterized by “growth advantage in stationary phase” (GASP) mutations
- Population dynamics show cycles of death and regrowth of adapted variants
- Cryptic Growth Phase:
- Period during death phase where surviving cells grow on nutrients released from dead cells
- Results in complex population dynamics with microcolonies of resistant variants
- Can maintain low-level population viability for extended periods
| Growth Phase | Cell Number Dynamics | Metabolic Activity | Key Cellular Processes | Practical Significance |
|---|---|---|---|---|
| Lag | Constant or slight decrease | High but not reproductive | Enzyme induction, repair, adaptation | Important in food safety, inoculum preparation |
| Exponential | Doubling at constant rate | Maximal, balanced | Rapid DNA replication, protein synthesis, cell division | Used in industrial fermentation, antibacterial testing |
| Stationary | Stable (growth = death) | Reduced, maintenance-focused | Stress response, secondary metabolite production | Antibiotic production, industrial metabolite harvesting |
| Death | Logarithmic decrease | Minimal in dying cells | Autolysis, sporulation attempts | Food preservation, sterilization validation |
| Cryptic Growth | Complex dynamics | Variable | Scavenging, adaptation to nutrient limitation | Environmental persistence, bioremediation |
5. Mathematical Representation of Bacterial Growth
The quantitative analysis of bacterial growth provides valuable insights for both theoretical understanding and practical applications:
- Growth Rate (μ):
- Definition: The rate of increase in cell number per unit time per cell.
- Formula: μ = (ln N₂ – ln N₁) / (t₂ – t₁)
- Where N₁ and N₂ are cell numbers at times t₁ and t₂ respectively.
- Units: Usually expressed as hr⁻¹.
- Relationship to Doubling Time: μ = ln(2)/td where td is the doubling time.
- Generation (Doubling) Time:
- Definition: Time required for the bacterial population to double in number.
- Formula: td = ln(2)/μ ≈ 0.693/μ
- Range: Varies from about 20 minutes for Escherichia coli in optimal conditions to several days for slow-growing species like Mycobacterium tuberculosis.
- Specific Growth Rate Constants for Various Bacteria:
| Bacterial Species | Optimal Temperature (°C) | Generation Time | Growth Rate Constant (μ) |
|---|---|---|---|
| Escherichia coli | 37 | 20 min | 2.08 hr⁻¹ |
| Bacillus subtilis | 37 | 25-30 min | 1.39-1.66 hr⁻¹ |
| Staphylococcus aureus | 37 | 27-30 min | 1.39-1.54 hr⁻¹ |
| Pseudomonas aeruginosa | 37 | 32-38 min | 1.10-1.30 hr⁻¹ |
| Lactobacillus acidophilus | 37 | 60-90 min | 0.46-0.69 hr⁻¹ |
| Mycobacterium tuberculosis | 37 | 12-24 hrs | 0.029-0.058 hr⁻¹ |
- Monod Kinetics:
- Purpose: Describes the relationship between specific growth rate and limiting substrate concentration.
- Formula: μ = μmax × [S/(Ks + S)]
- μmax = maximum specific growth rate
- S = substrate concentration
- Ks = substrate concentration at half μmax (saturation constant)
- Applications: Essential for bioprocess engineering, wastewater treatment modeling, and understanding nutrient competition.
- Growth Yield Coefficient (Y):
- Definition: Amount of biomass produced per unit of substrate consumed.
- Formula: Y = ΔX/ΔS
- ΔX = increase in biomass
- ΔS = amount of substrate consumed
- Significance: Indicates the efficiency of substrate conversion to cell material.
- Logistic Growth Model:
- Purpose: Models growth with population-dependent limitations.
- Formula: dN/dt = rN(1-N/K)
- r = intrinsic growth rate
- K = carrying capacity of the environment
- N = population size
- Application: Better represents natural bacterial growth with environmental constraints.
6. Methods for Measuring Bacterial Growth
Various techniques are employed to quantify bacterial growth, each with specific advantages and limitations:
- Direct Cell Counting:
- Total Cell Count: Using counting chambers (like Petroff-Hausser or hemocytometer) to count cells microscopically.
- Electronic Cell Counters: Instruments like Coulter counters that detect changes in electrical resistance as cells pass through an aperture.
- Flow Cytometry: Rapid analysis of individual cells in a flowing stream, allowing simultaneous measurement of multiple cellular parameters.
- Advantages: Direct observation of cell numbers and morphology.
- Limitations: Cannot distinguish viable from non-viable cells without additional staining; labor-intensive for microscopic methods.
- Viable Cell Counting:
- Plate Count Method: Diluting and plating bacterial suspensions on agar media to count colony-forming units (CFUs).
- Most Probable Number (MPN): Statistical method using multiple serial dilutions in liquid media.
- Advantages: Measures only viable cells capable of reproduction.
- Limitations: Time-consuming (24-48 hours); underestimates species that form chains or clusters; misses viable but non-culturable (VBNC) cells.
- Turbidity Measurements:
- Spectrophotometry: Measuring optical density (OD) or absorbance, typically at 600 nm.
- Nephelometry: Measuring scattered light rather than absorbance.
- Relationship to Cell Number: Approximately linear relationship between OD and cell concentration in the range of 0.1-0.5 (approximately 10⁷-10⁸ cells/ml for many bacteria).
- Advantages: Rapid, non-destructive, easily automated.
- Limitations: Cannot distinguish between live and dead cells; affected by cell size and morphology changes; low sensitivity at low cell concentrations.
- Biomass Measurement:
- Dry Weight Determination: Filtering and drying bacterial suspensions to measure mass.
- Protein Content: Using assays like Bradford or Lowry to quantify total cellular protein.
- Advantages: Directly measures the quantity of cellular material.
- Limitations: Destructive; cannot distinguish between viable and non-viable biomass; requires relatively large sample volumes.
- Metabolic Activity Measurements:
- Oxygen Consumption: Using oxygen electrodes or respirometers.
- Carbon Dioxide Production: Measuring gas production or pH changes.
- ATP Assays: Quantifying adenosine triphosphate as an indicator of viable biomass.
- Tetrazolium Reduction: Colorimetric assays based on reduction of compounds like MTT or XTT by metabolically active cells.
- Advantages: Measures actual metabolic activity; can detect viable but non-culturable cells.
- Limitations: May not directly correlate with cell numbers; affected by changes in per-cell metabolic activity.
- Molecular Methods:
- Quantitative PCR (qPCR): Amplifying and quantifying specific DNA sequences.
- Reverse Transcription qPCR (RT-qPCR): Targeting mRNA to measure gene expression.
- Fluorescence In Situ Hybridization (FISH): Using fluorescent probes to identify and enumerate specific bacterial groups.
- Advantages: Highly specific; can target particular species or strains; can distinguish viable cells using RNA targets or viability dyes.
- Limitations: Expensive; may detect DNA from dead cells; requires specialized equipment and expertise.
| Measurement Method | Principle | Advantages | Limitations | Typical Applications |
|---|---|---|---|---|
| Plate Count | Colony formation from viable cells | Measures viable cells only; can isolate pure cultures | Time-consuming; underestimates clustering organisms | Food microbiology, water testing |
| Spectrophotometry (OD600) | Light scattering/absorption by cells | Rapid, non-destructive, easily automated | Cannot distinguish viable/non-viable cells; nonlinear at high densities | Research labs, growth curve monitoring |
| Flow Cytometry | Light scattering and fluorescence of individual cells | Rapid; can assess viability with proper stains; provides multiple parameters | Expensive equipment; complex data interpretation | Research, clinical microbiology |
| qPCR | DNA amplification and detection | Highly sensitive and specific; can target specific species | May detect DNA from dead cells; expensive | Environmental microbiology, pathogen detection |
| ATP Bioluminescence | ATP-dependent light production | Rapid; correlates with viable biomass | Affected by ATP content variations; sensitive to contamination | Food industry, hygiene monitoring |
7. Growth in Batch vs. Continuous Culture
Different culture systems create distinct growth environments that significantly affect bacterial growth dynamics:
- Batch Culture:
- Definition: A closed system where nutrients are provided once at the beginning, and waste products accumulate over time.
- Growth Pattern: Exhibits the classical four-phase growth curve (lag, exponential, stationary, death).
- Limitations: Nutrient depletion, waste accumulation, and changing environmental conditions.
- Applications: Laboratory studies, industrial processes with defined product cycles, vaccine production.
- Advantages: Simple setup, well-defined beginning and end points, easier contamination control.
- Disadvantages: Changing growth conditions, limited productivity, labor-intensive for repeated batches.
- Fed-Batch Culture:
- Definition: A semi-closed system where nutrients are added incrementally or continuously without removing culture fluid.
- Growth Pattern: Extended exponential phase with delayed onset of stationary phase.
- Control Parameters: Feeding rate, substrate concentration, dissolved oxygen.
- Applications: Production of biomass, enzymes, and metabolites where high cell density is advantageous.
- Advantages: Higher cell densities and productivity than batch culture; control over growth rate through feeding strategy.
- Disadvantages: More complex than batch culture; waste product accumulation remains a limiting factor.
- Continuous Culture:
- Definition: An open system where fresh medium is continuously added and culture liquid with cells is continuously removed at the same rate.
- Types:
- Chemostat: Growth limited by a single nutrient; dilution rate controls growth rate.
- Turbidostat: Cell density controlled by adjusting dilution rate based on turbidity measurements.
- Mathematical Relationship: At steady state, μ = D (growth rate equals dilution rate).
- D = F/V where F is flow rate and V is culture volume.
- Growth Characteristics: Maintains cells in constant exponential phase at steady state.
- Applications: Continuous production of bacterial products, ecological studies, evolution experiments.
- Advantages: Constant environmental conditions, sustained productivity, reduced labor per unit product.
- Disadvantages: Higher risk of contamination, potential for genetic instability, more complex equipment requirements.
- Comparison of Growth Parameters:
| Parameter | Batch Culture | Fed-Batch Culture | Continuous Culture (Chemostat) |
|---|---|---|---|
| Growth Phases | All four phases observed | Extended exponential phase | Maintained at constant exponential phase |
| Growth Rate | Variable, maximum during exponential phase | Controlled by feeding rate | Constant, determined by dilution rate |
| Cell Density | Limited by initial nutrients | Higher than batch due to feeding | Constant at steady state |
| Nutrient Concentration | Decreasing over time | Controlled by feeding strategy | Constant at steady state (except limiting nutrient) |
| Productivity | Periodic | Extended but finite | Continuous and stable |
| Genetic Stability | Generally stable | Intermediate | Can select for faster-growing mutants over time |
| Application Examples | Antibiotic production, laboratory studies | Recombinant protein production, high-density cultivation | Enzyme production, continuous bioprocessing |
8. Environmental and Physiological Factors Affecting Growth Curve
The shape and characteristics of the bacterial growth curve are significantly influenced by various environmental and physiological factors:
- Temperature Effects:
- Below Optimal: Extended lag phase, reduced growth rate, prolonged generation time.
- At Optimal: Shortest lag phase, maximum growth rate, typical growth curve.
- Above Optimal: Stress response activation, protein denaturation risk, rapid transition to death phase.
- Growth Rate Relationship: Follows Arrhenius equation within physiological range.
- pH Influences:
- Outside Optimal Range: Extended lag phase, reduced maximum cell density.
- Extreme pH: Activation of stress response systems, increased maintenance energy requirements.
- pH Changes During Growth: Many bacteria produce acids or bases as metabolic byproducts, altering the medium pH over time.
- Buffering Capacity: Media with higher buffering capacity show more consistent growth patterns.
- Oxygen Availability:
- For Aerobes: Oxygen limitation leads to reduced growth rate and earlier stationary phase.
- For Anaerobes: Oxygen exposure causes growth inhibition or death due to oxidative damage.
- For Facultative Anaerobes: Metabolic shifting between respiratory and fermentative pathways affects growth efficiency and byproduct formation.
- Dissolved Oxygen: Critical parameter in industrial fermentation; affects both growth rate and metabolite production.
- Nutrient Concentration and Quality:
- Carbon Source: Affects growth yield coefficient and maximum cell density.
- Preferred vs. Secondary Nutrients: Diauxic growth patterns when multiple carbon sources are present.
- Limiting Nutrients: Determine the carrying capacity and timing of stationary phase onset.
- Nutrient Complexity: Complex media often support shorter lag phases than defined media.
- Inoculum Characteristics:
- Age of Inoculum: Stationary phase cells typically show longer lag phases than exponential phase cells.
- Size of Inoculum: Smaller inocula result in longer lag phases but eventually reach similar maximum densities.
- Physiological State: Stressed or damaged cells require longer adaptation periods.
- Genetic Diversity: More diverse populations may show greater adaptive capability to new environments.
- Growth Inhibitors:
- Antibiotics: Different mechanisms of action affect specific phases of the growth curve.
- Metabolic Byproducts: Accumulation can cause feedback inhibition and early stationary phase entry.
- Bacteriocins: Growth inhibition of sensitive strains by competing bacterial species.
- Bacteriophages: Viral infection can cause population crashes during any growth phase.
- Cell-to-Cell Communication:
- Quorum Sensing: Density-dependent signaling affects gene expression patterns throughout the growth curve.
- Biofilm Formation: Surface attachment and extracellular matrix production alter growth dynamics.
- Secreted Enzymes: Extracellular enzymes can modify the environment and nutrient availability.
- Coordinated Behaviors: Some behaviors like sporulation occur in response to specific population densities and environmental cues.
9. Applied Aspects of Bacterial Growth Curves
Understanding bacterial growth curves has numerous practical applications across various fields:
- Industrial Microbiology and Biotechnology:
- Fermentation Optimization: Determining ideal harvesting times for primary (growth-associated) and secondary (non-growth-associated) metabolites.
- Scale-up Considerations: Accounting for changes in growth patterns when transitioning from laboratory to industrial scale.
- Process Control: Using growth curve data to develop feedback control systems for bioreactors.
- Strain Development: Selecting for variants with altered growth characteristics (faster growth, higher stress tolerance, extended production phases).
- Food Microbiology and Safety:
- Shelf Life Prediction: Modeling microbial growth to estimate product stability and safety over time.
- Hurdle Technology: Combining preservation factors that affect different aspects of the growth curve.
- Challenge Testing: Inoculating foods with specific pathogens to validate preservation methods.
- Predictive Microbiology: Developing mathematical models of growth under various conditions to predict food safety risks.
- Clinical Microbiology:
- Antibiotic Susceptibility Testing: Measuring growth inhibition to determine effective antimicrobial treatments.
- Growth-Based Diagnostics: Identifying pathogens based on characteristic growth patterns.
- Antimicrobial Development: Targeting specific growth phases for more effective antimicrobial action.
- Pharmacodynamic Modeling: Understanding how antimicrobial concentration affects bacterial growth and death rates.
- Environmental Microbiology:
- Bioremediation: Optimizing conditions for growth of pollution-degrading bacteria.
- Wastewater Treatment: Managing microbial populations for efficient organic matter removal.
- Microbial Ecology: Understanding competitive dynamics between different bacterial species.
- Biofilm Management: Controlling surface-attached bacterial communities in industrial and medical settings.
- Research Applications:
- Synthetic Biology: Characterizing growth properties of engineered organisms.
- Systems Biology: Integrating growth data with other -omics approaches for comprehensive understanding.
- Evolution Studies: Examining how growth parameters change under selective pressures.
- Stress Response Research: Investigating bacterial adaptation to environmental challenges.
10. Modern Perspectives and Advanced Concepts
Recent advances in technology and analytical methods have expanded our understanding of bacterial growth beyond the classical model:
- Single-Cell Growth Analysis:
- Technology Developments: Microfluidic devices, time-lapse microscopy, and flow cytometry enable tracking of individual cells.
- Heterogeneity Findings: Significant cell-to-cell variation exists even in clonal populations.
- Growth Rate Distribution: Population-level growth rates represent averages of diverse individual behaviors.
- Division Asymmetry: Unequal partitioning of cellular components during division creates phenotypic diversity.
- Growth in Structured Environments:
- Biofilm Growth Dynamics: Three-dimensional growth in biofilms follows distinct patterns compared to planktonic growth.
- Spatial Organization: Resource gradients in structured environments create zones with different growth characteristics.
- Intercellular Interactions: Physical contact and proximity affect growth patterns through various signaling mechanisms.
- Emerging Models: Moving beyond well-mixed batch cultures to more realistic environmental simulations.
- Persisters and Viable but Non-Culturable (VBNC) States:
- Persister Cells: Non-growing phenotypic variants that show high tolerance to antibiotics without genetic resistance.
- VBNC State: Metabolically active cells that temporarily lose culturability while maintaining viability.
- Resuscitation Factors: Compounds that can trigger VBNC cells to resume normal growth and division.
- Clinical Relevance: These states contribute to chronic infections and treatment failures.
- Growth-Independent Survival:
- Zero-Growth Viability: Bacterial survival without net population increase.
- Maintenance Energy: Minimum energy required for cellular integrity and basic functions without growth.
- Dormancy Mechanisms: Spore formation, persister state induction, and metabolic hibernation.
- Ecological Significance: These mechanisms enable long-term survival in harsh or nutrient-limited environments.
- Systems Biology of Growth:
- Genome-Scale Models: Mathematical representations of entire metabolic networks to predict growth under various conditions.
- Proteome Allocation: How bacteria optimize protein synthesis for growth versus stress response.
- Growth Rate-Dependent Gene Expression: Systematic changes in gene expression patterns at different growth rates.
- Resource Allocation Trade-offs: Balance between growth, survival, and stress resistance.
- Artificial Intelligence Applications:
- Machine Learning Models: Predicting growth parameters from genomic and environmental data.
- Automated Growth Curve Analysis: Advanced algorithms for extracting parameters from experimental data.
- Growth Pattern Recognition: Identifying characteristic signatures for rapid bacterial identification.
- Complex Media Optimization: Using AI to design growth media for difficult-to-culture bacteria.
| Modern Concept | Traditional View | Updated Understanding | Practical Implications |
|---|---|---|---|
| Population Heterogeneity | Bacterial cultures are homogeneous | Significant cell-to-cell variation exists even in clonal populations | Explains treatment failures, persistence of infections |
| Growth States | Binary classification: growing or non-growing | Spectrum of growth states with various metabolic activities | New antimicrobial strategies targeting different states |
| Environmental Structure | Well-mixed environments in laboratory settings | Spatially structured habitats with resource gradients | More realistic modeling of natural bacterial communities |
| Growth Efficiency | Maximizing growth rate as default strategy | Trade-offs between growth rate, yield, and stress resistance | Understanding ecological strategies and engineering optimal strains |
| Microbial Interactions | Growth studied in isolation | Growth affected by interspecies communication and competition | Complex community dynamics influence individual species growth |
11. Frequently Asked Questions (FAQ)
Q1. What is the bacterial growth curve and why is it important?
The bacterial growth curve is a graphical representation of bacterial population change over time in a closed culture system. It’s important because it provides a fundamental framework for understanding bacterial population dynamics, predicting microbial behavior in various settings, optimizing industrial fermentation processes, developing effective antimicrobial strategies, and ensuring food safety. The growth curve concept is central to virtually all areas of applied microbiology.
Q2. What are the four main phases of bacterial growth?
The four main phases are: (1) Lag phase – when bacteria adapt to new environmental conditions with minimal population increase; (2) Exponential phase – when bacteria multiply at their maximum rate with regular doubling; (3) Stationary phase – when the growth rate equals the death rate, resulting in stable population numbers; and (4) Death phase – when the number of dying cells exceeds new cell formation, leading to population decline.
Q3. What factors affect the length of the lag phase?
The lag phase duration is influenced by several factors: the physiological state of the inoculum (cells from exponential phase have shorter lag than those from stationary phase); inoculum size (smaller inocula generally have longer lag phases); the difference between previous and new growth conditions (greater changes require longer adaptation); cell damage extent (injured cells need time for repair); and the complexity of the required enzymatic adaptations to utilize available nutrients.
Q4. How is the generation time (doubling time) calculated?
Generation time (td) can be calculated using the formula: td = (t₂ – t₁) × log(2) / [log(N₂) – log(N₁)], where t₁ and t₂ are two time points during exponential growth, and N₁ and N₂ are the number of bacteria at those respective times. Alternatively, if the specific growth rate (μ) is known, the generation time can be calculated as td = ln(2)/μ, which approximately equals 0.693/μ.
Q5. What’s the difference between batch and continuous culture systems?
Batch culture is a closed system where nutrients are provided once at the beginning and bacteria proceed through all growth phases as nutrients deplete and wastes accumulate. Continuous culture is an open system where fresh medium is continuously added and culture liquid with cells is continuously removed, maintaining cells in a steady state of exponential growth. The key difference is that batch cultures undergo environmental changes over time, while continuous cultures maintain constant conditions.
Q6. How do bacteria respond to nutrient limitation?
When facing nutrient limitation, bacteria undergo several adaptations: they activate stringent response pathways that downregulate processes related to growth and division; induce scavenging systems for limited nutrients; upregulate alternative metabolic pathways; reduce cell size to increase surface-to-volume ratio; produce storage compounds if possible; express stress response genes for survival; and in some species, form more resistant structures like spores or enter dormant states.
Q7. Why does bacterial growth eventually stop in a batch culture?
Growth in batch culture eventually stops due to several factors working simultaneously: depletion of essential nutrients (carbon, nitrogen, phosphorus, or micronutrients); accumulation of toxic metabolic waste products (acids, alcohols, or other inhibitory compounds); unfavorable pH changes resulting from metabolic activities; oxygen depletion in aerobic cultures; increased cell density leading to space limitations; and quorum sensing mechanisms that regulate population density.
Q8. How do antibiotics affect the bacterial growth curve?
Different antibiotics affect the growth curve in distinct ways based on their mechanisms of action: bacteriostatic antibiotics (like tetracyclines) prevent population increase but may not cause immediate death, flattening the curve; bactericidal antibiotics (like β-lactams) actively kill bacteria, causing population decline; cell wall synthesis inhibitors often show delayed killing until cell division attempts; protein synthesis inhibitors may show immediate growth cessation; and the effect timing depends on whether the antibiotic targets growing cells specifically or all physiological states.
Q9. What is diauxic growth and when does it occur?
Diauxic growth refers to a biphasic growth pattern with two exponential phases separated by a lag period, occurring when bacteria are provided with two different carbon sources. Bacteria preferentially utilize the more easily metabolized substrate first (often glucose). When this preferred substrate is depleted, bacteria undergo a temporary lag phase to synthesize enzymes needed for metabolizing the secondary substrate, followed by a second exponential growth phase. This phenomenon illustrates bacterial regulatory mechanisms like catabolite repression.